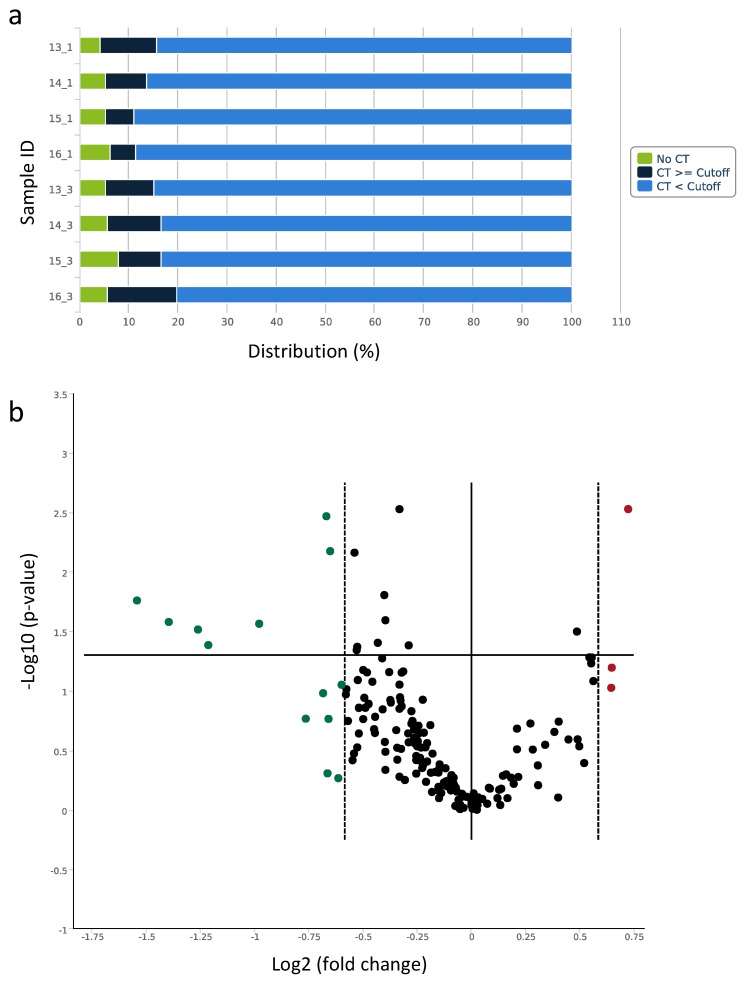
Figure 5.
qPCR-based serum/plasma focus panel of circulating miRNAs (a) Distribution of Ct values for the processed data of each plasma sample. (b) Volcano plot of differentially expressed miRNAs pre- and post-LI-BFR training. Data points outside the two dashed lines are up-regulated (red) or down-regulated (green) more than x-fold. Data points above the solid horizontal line have p-values less than 0.05.

