Figure 2.
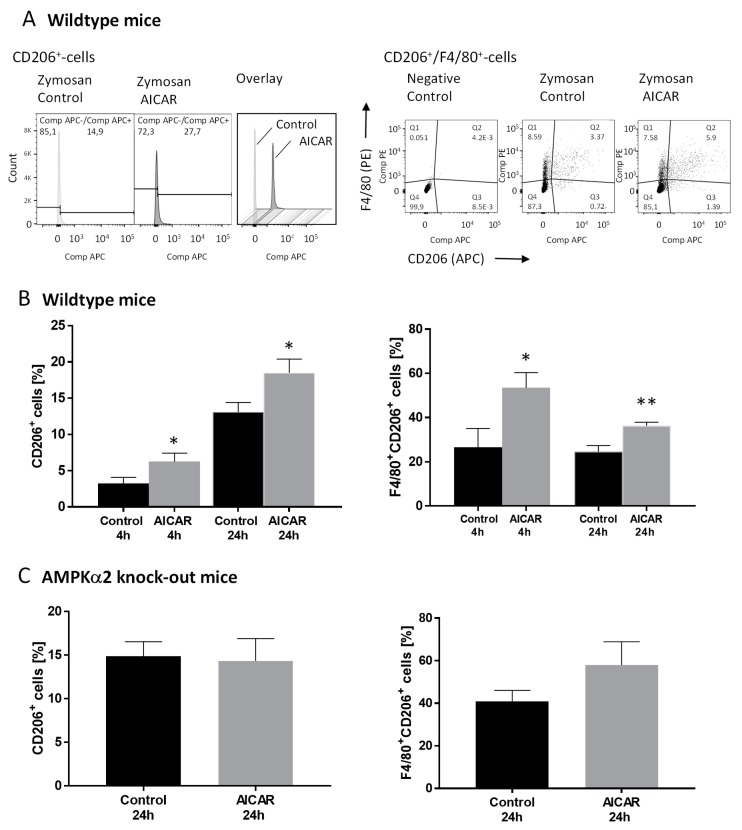
The fluorescence-activated cell sorting (FACS) analysis of CD206-positive immune cells in the zymosan-induced edema. The FACS analysis of CD206+ and CD206+/F4/80+ cells in the paws of mice in the zymosan-induced paw inflammation model. Paw tissue samples were collected 4 (n = 3–4/group) and 24 h (n = 9/group) after zymosan injection with and without the intraperitoneal injection of AICAR (400 mg/kg body weight). (A) Left: Exemplary histograms showing the percentage of CD206+ cells in paws of control mice and AICAR-treated mice 24 h after zymosan injection. Right: Exemplary dot blots showing the percentage of CD206+/F4/80+ cells in paws of control mice and AICAR-treated mice 24 h after zymosan injection. The diagrams in (B) show the percentage of CD206 positive cells compared to the total cell count and the percentages of F4/80+/CD206+ cells in wild type mice 4 and 24 h after zymosan injection. * p < 0.05, ** p < 0.01 statistically significant difference in comparison with control. (C) Percentage of CD206+ and CD206+/F4/80+ cells in the paws of AMPKα2−/− mice 24 h after induction of paw inflammation by zymosan. AICAR-treated mice were compared with control mice. (n = 3–4/group).

