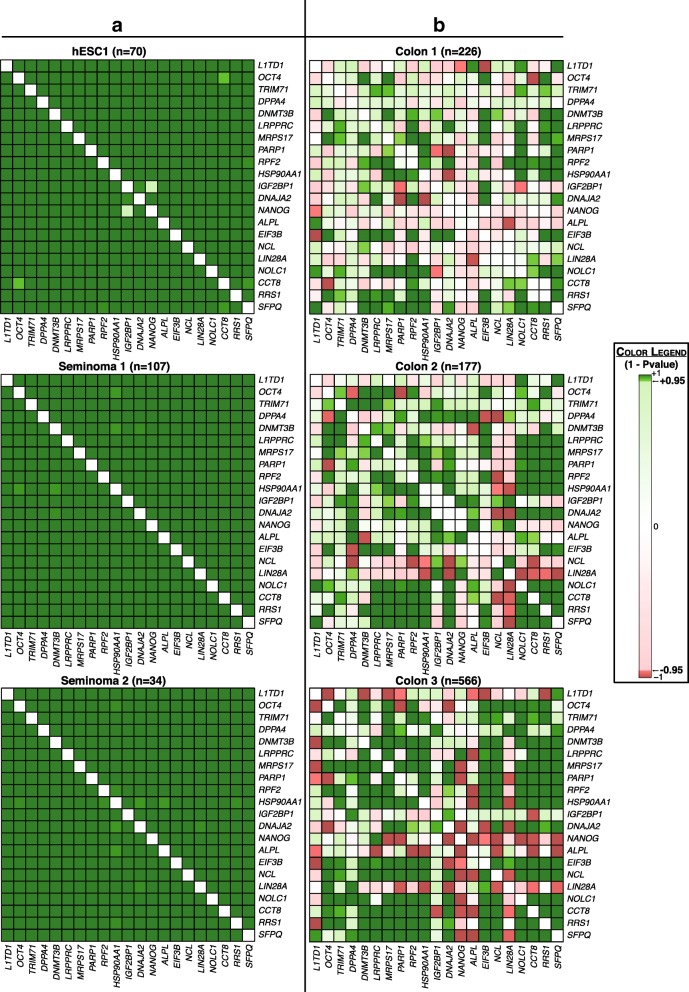
Fig. 2.
Co-expression of interaction partners of L1TD1. Heatmaps showing signed P-value of Spearman rank correlation for the 20 most significantly co-expressed interaction partners of L1TD1 determined on the basis of the seminoma and stem cell data sets. Co-expression in (a) seminoma and stem cell data sets, and (b) colon cancer data sets. The signed P-value of Spearman rank correlation was defined as 1 - P-value of Spearman rank correlation multiplied by the sign of the correlation

