Fig. 6.
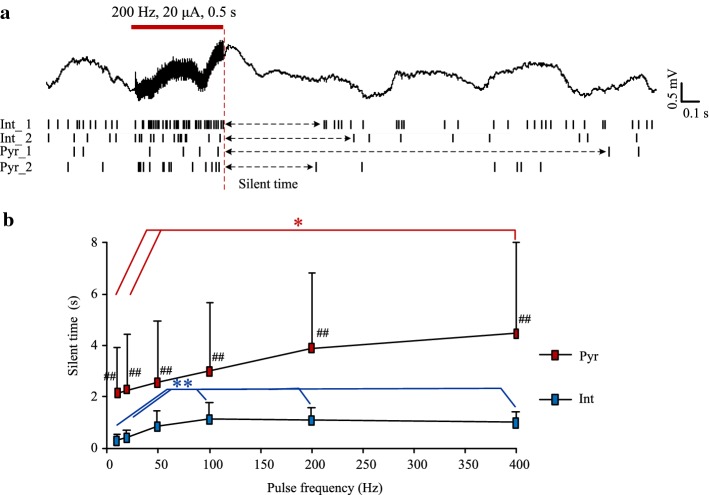
Silent periods of neuronal firing following 0.5-s stimulations with various pulse frequencies. a A recording example of 200 Hz stimulation. The red dashed line denotes the end of stimulation. The raster plots show the firing of 2 interneurons and 2 pyramidal cells. b The mean lengths of silent period of interneurons and pyramidal cells changed as a function of the pulse frequencies. *P < 0.05, post-hoc Bonferroni tests after ANOVA with P < 0.05. **P < 0.01, post-hoc Bonferroni tests after ANOVA with P < 0.01. ##P < 0.01, t tests between interneurons and pyramidal cells. n = 12 for interneurons (Int); n = 27 for pyramidal cells (Pyr)

