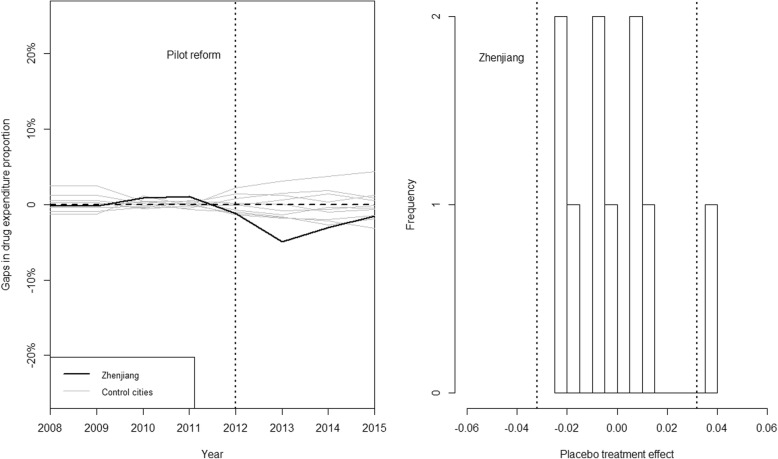
Fig. 5.
Graphical results of the placebo tests for Inpatient care. Legend: left panel: placebo effects: Zhenjiang VS. control cities; right panel: histogram for placebo effects. The histogram summarized the distribution of estimated placebo effects for control cities. The dashed lines indicate the estimated mean reform effect for Zhenjiang and its opposite value

