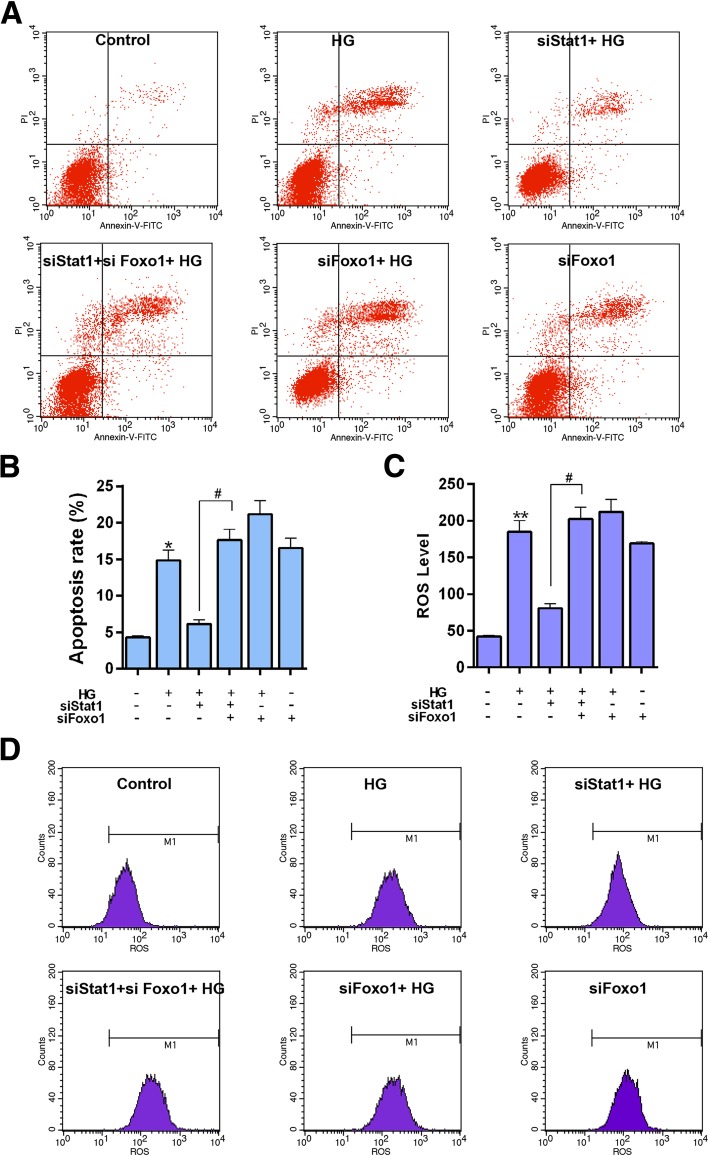
Fig. 10.
The effect of simultaneous silencing Stat1 and FoxO1 on apoptosis and ROS level. The experiments were divided into six groups, which were control, HG (30 μM), siStat1 + HG (Stat1 siRNA + 30 μM HG), siStat1 + siFoxO1 + HG (Stat1 siRNA + FoxO1 siRNA + 30 μM HG), siFoxO1 + HG (FoxO1 siRNA + 30 μM HG) and siFoxO1 (FoxO1 siRNA). a Apoptosis levels were detected by flow cytometry. b Relative apoptosis rate showed as bar diagrams. c ROS level showed as bar diagrams. d ROS levels were detected by flow cytometry. Data were expressed as mean ± SD from three independent experiments. (*Compared with control, # Compared with siStat1 + HG, */#P < 0.05, **/##P < 0.01)

