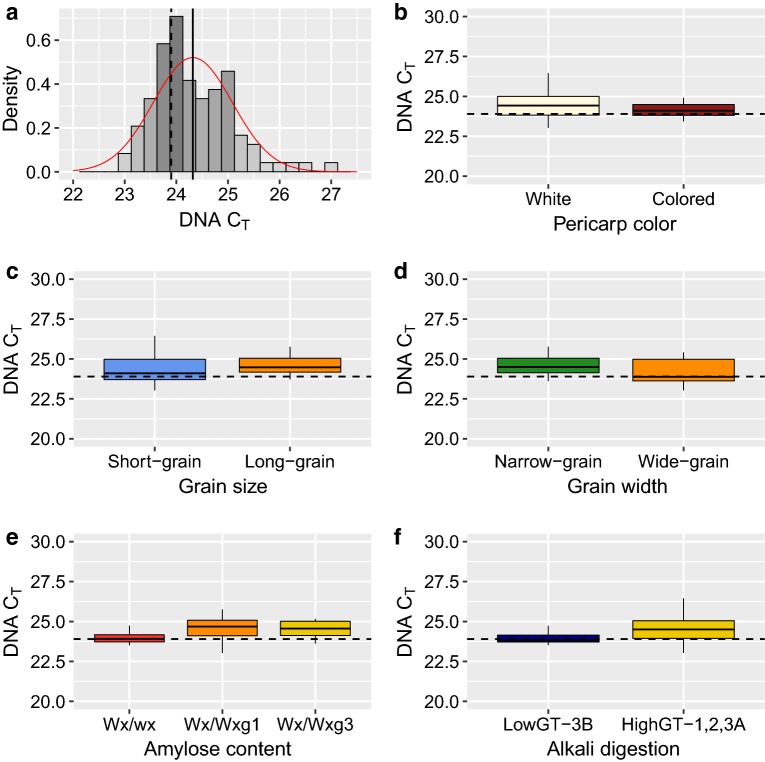
Fig. 1.
CT values distribution and comparisons between single seed samples with varying physical and chemical properties. a Distribution of CT values for DNA from 96 different single seed samples in rice. The average CT value on rice seeds (CT = 24.3) is illustrated with a solid line and the average CT value obtained using leaf tissue (CT = 23.9) is illustrated by a dashed line. Analysis of variance among seeds with different b pericarp color, c grain size, d grain width, e active amylose-content, and f alkali digestibility. The average CT value estimated in leaf tissue (CT = 23.9) is illustrated in each boxplot by a dashed line and the acronym ‘n.s’ indicates a non-significant difference between classifications

