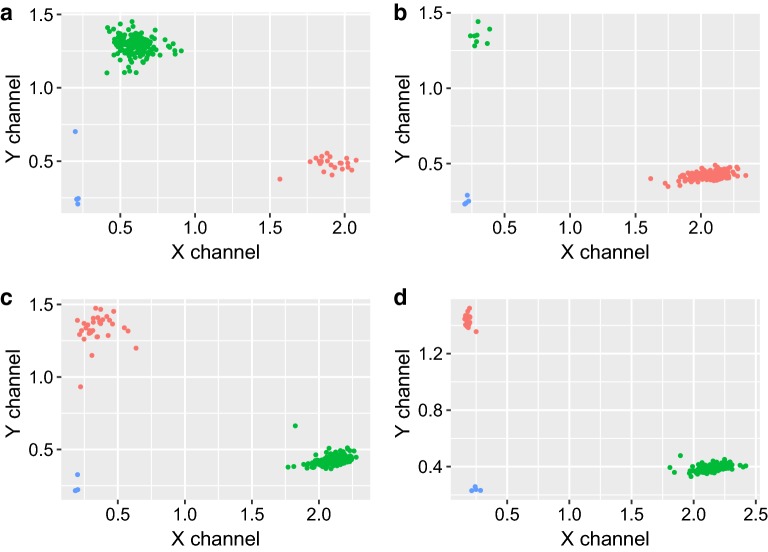
Fig. 2.
Kompetitive allele specific PCR cartesian plots. HEX™ (Y channel) versus FAM™ (X channel) intensity scatter plots for the KASP assay a snpOS002, b snpOS0006, c snpOS0007b, and d snpOS0015 associated with the loci xa13, Pi-ta, Pi9, and Pi54 respectively. Each panel contains results of the SNP assay for 96 single seed samples. Blue dots represent negative controls; green and red dots represent different alleles of each marker

