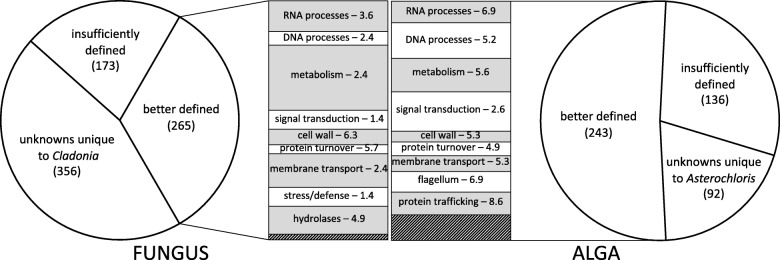
Fig. 8.
Classes of genes differentially induced during early fungus-alga interactions in coculture. The pie charts divide the induced genes for each symbiont into three broad classes (numbers of genes in parentheses). The “better defined” genes are subdivided in groups roughly comparable between the symbionts (gray and white boxes). The area of each box is proportional to the percent of genes it contains relative to all better defined genes (265 for the fungus and 243 for the alga). The number behind each group’s name indicates its enrichment factor relative to the whole genome (see Methods). The hatched areas represent groups with less than 10 genes each. The p values for the enrichment of the indicated groups within the induced genes are all < 0.05, and most are << 10− 3

