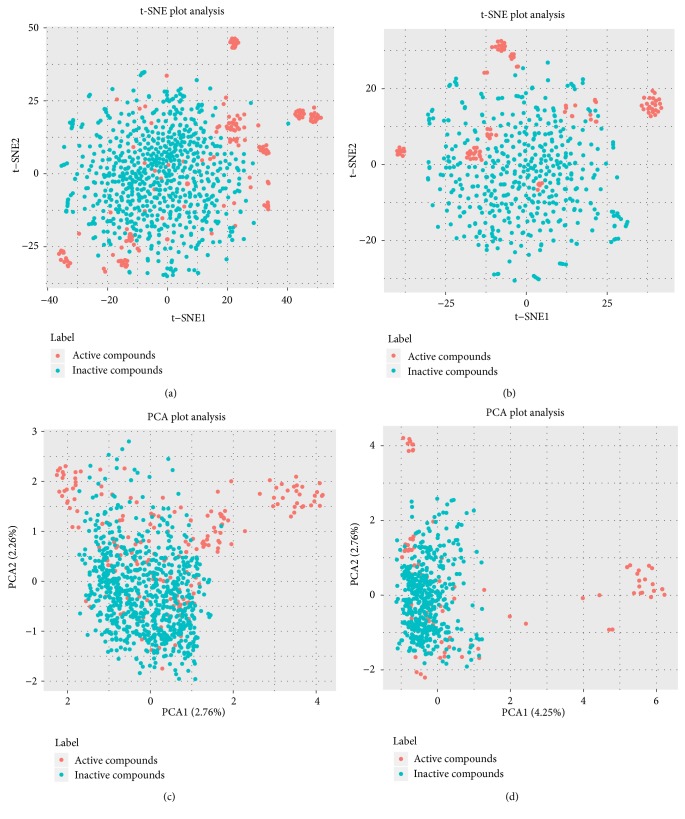
Figure 2.
Visual representation of the chemical space of active compounds (red) and inactive compounds (light green) against hypoxia-induced (a and c) and H2O2-induced (b and d) neurotoxicity. The visualizations of (a) and (b) were generated using t-distributed stochastic neighbor embedding (t-SNE) based on Morgan fingerprints (4096 bits). The visualizations of (c) and (d) were generated using principal component analysis (PCA) based on Morgan fingerprints (4096 bits).

