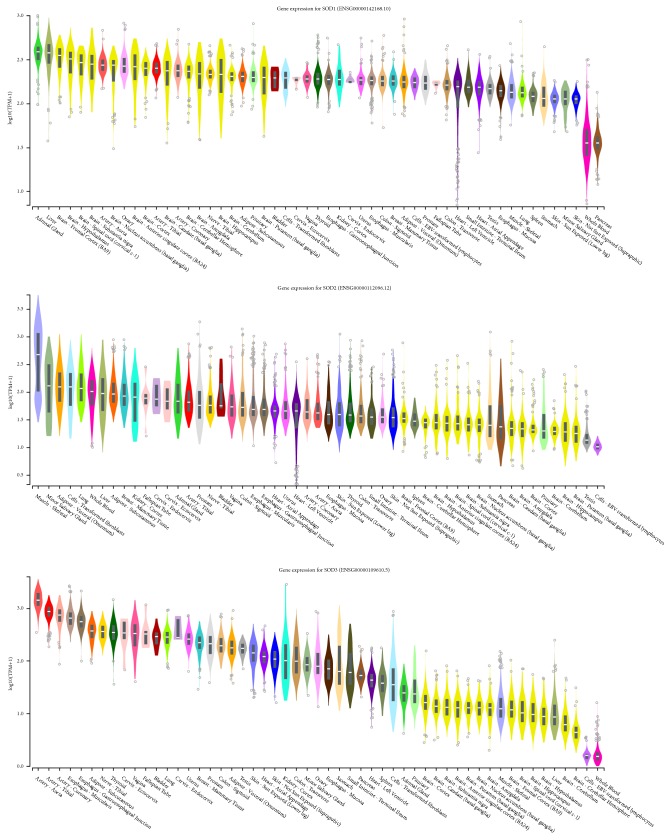
Figure 1.
GTEx Analysis Release V7 Gene expression showing gene expressions of the SOD family of enzymes in TPM (Transcripts Per Million) represented logarithmically. SOD1 has high expression in regions of the brain, SOD 2 is uniform amongst somatic cells, and SOD3 has high expression in Aorta, Tibial, and Coronary arteries.

