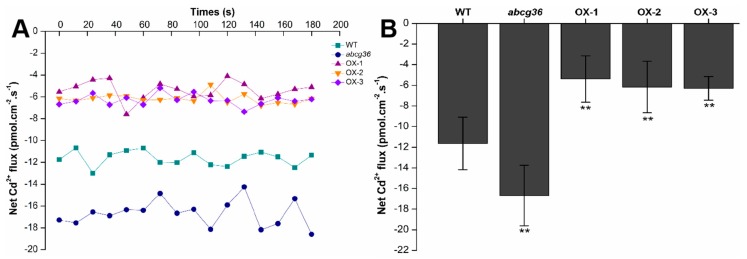
Figure 6.
Net Cd2+ fluxes. Net Cd2+ fluxes in the roots of WT, abcg36 mutant and transgenic plants (OX-1, OX-2, and OX-3) treated with CdCl2 stress (A). The average 180 s net Cd2+ fluxes are illustrated to highlight the trend differences (B). Bars indicate means ± SD. Student’s t-test, * p <0.05, ** p < 0.01.

