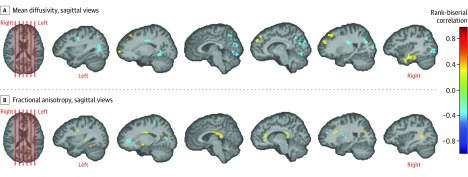
Figure 3. Differences in Tissue Microstructural Integrity in the Cerebrum.
Results of a voxel-based analysis of tissue microstructural integrity measures of fractional anisotropy and mean diffusivity in the cerebrum using Mann-Whitney U test are shown. This pertains to the testing of the secondary hypothesis that there were differences in tissue integrity in the cerebrums of patients as compared to controls. The statistical maps are color coded using rank-biserial correlation (a measure of effect size; range, −1 to 1) as shown in the color bar, which applies to both panels. These maps are overlaid on a template brain, with only the voxels showing differences (uncorrected P < .05) color coded. Results in the cerebellum are shown in Figure 2. Representative slices are shown in panel A for lower mean diffusivity in patients vs controls in 6 sagittal views of the brain (regions include anterior limb of the internal capsule and occipital white matter) and panel B for higher fractional anisotropy in patients vs controls in 6 sagittal views of the brain (regions include splenium of the corpus callosum). Locations of these chosen slices are shown by red lines on the template brain (first image in each panel).

