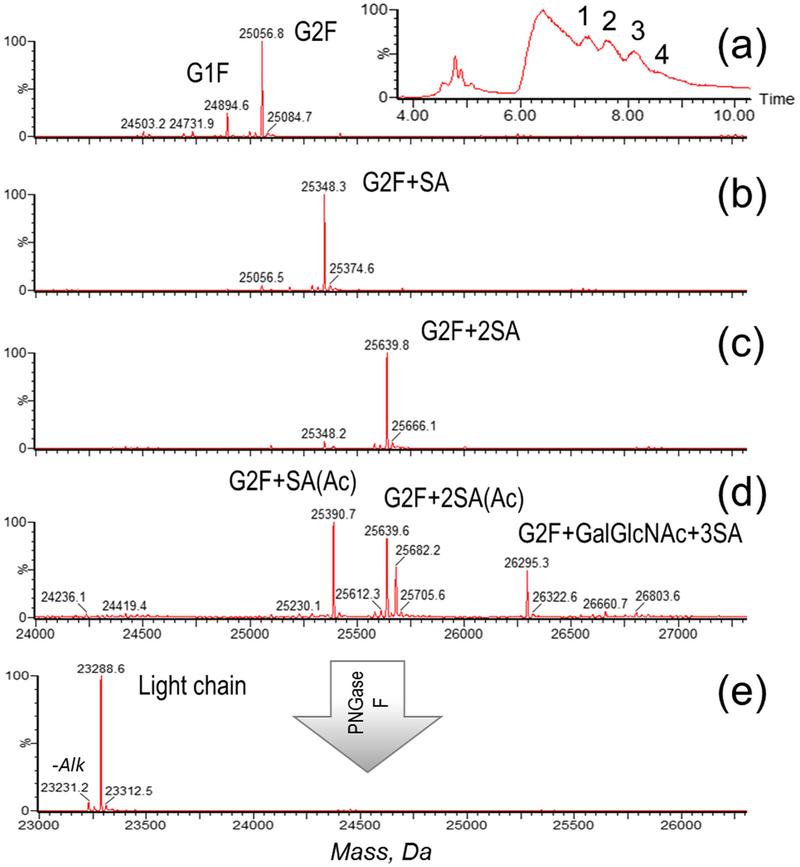
Figure 3.
Light chain characterization: TIC of the reduced CAP256 (inset) with the individual components of the light chain numbered, corresponding to the deconvoluted spectra of the light chain glycoforms (a–d) and deconvoluted spectrum of the deglycosylated light chain (e). An additional peak on the mass spectrum (e) corresponds to incomplete cysteine alkylation, a sample preparation artifact

