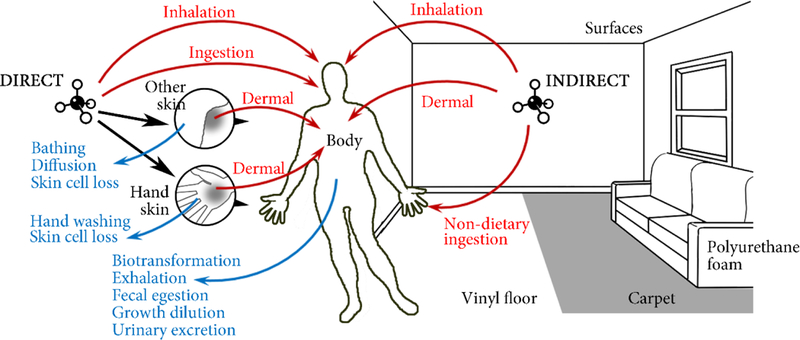
Figure 1.

Conceptual representation of the RAIDAR-ICE model indicating two mode-of-entry scenarios, that is, application of a chemical to human compartments (“direct”) and emissions to indoor compartments (“indirect”). Red arrows depict direct (i.e., inhalation, ingestion and dermal permeation) and indirect (i.e., inhalation, nondietary ingestion and dermal permeation) exposure pathways. Blue arrows depict processes eliminating a chemical from human compartments. Calculations of D-values are tabulated in SI Table S2. Mass balance of chemicals in human compartments is given in SI Text S1. Far-field exposure pathways (not shown) can also be included for quantification of aggregate human exposure.
