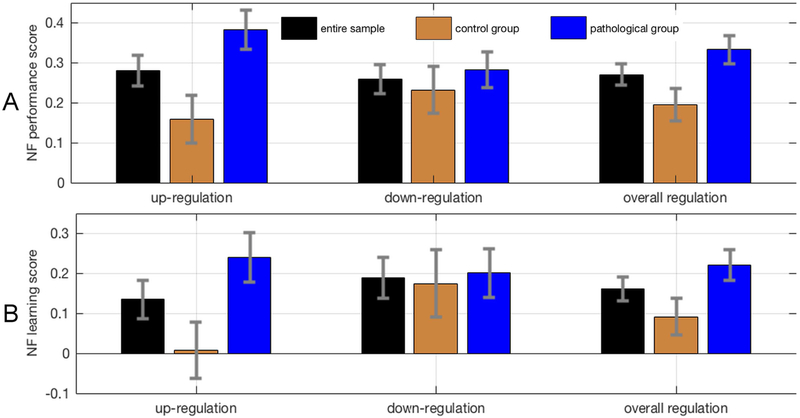
Figure 4. Neurofeedback scores across experimental groups.
A, Neurofeedback performance and neurofeedback learning scores for up-regulation, down-regulation and overall regulation. Scores are depicted separately for the control group, the pathological group and the entire sample. Error bars represent standard errors. Possible neurofeedback performance scores range from a value of −1 (corresponding to worst possible performance) to a value of 1 (corresponding to best possible performance). B, Possible neurofeedback learning scores range from a value of −2 (corresponding to worsening performance) to a value of 2 (corresponding to maximal learning).

