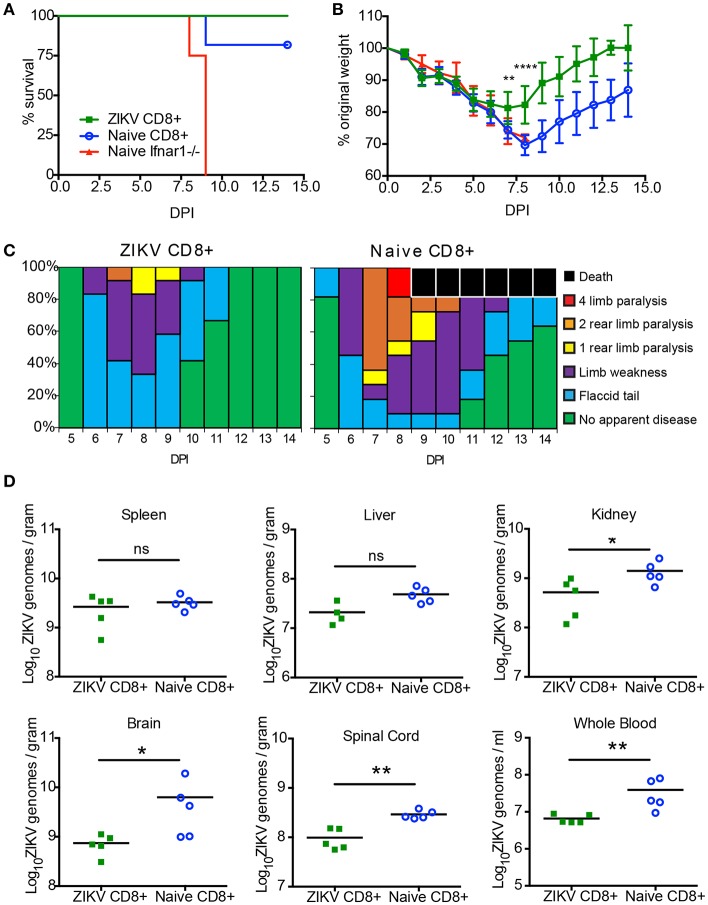
Figure 5.
CD8+ T cells are sufficient to protect against a lethal ZIKV challenge. (A) Survival of 10–12-week-old mice following adoptive transfer of CD8+ T cells and IV route ZIKV challenge. At 30 days post infection, CD8+ T cells were isolated to >97% purity from ZIKV infected or naïve C57BL/6J mice and transferred IV into 10- to 12-week-old Ifnar1−/− mice (~3 × 10⁶ /mouse) 1 day prior to IV infection with 105 FFU of ZIKV (n = 9–11 per group). Survival differences were not statistically significant between the two groups that received CD8 T cells but were statistically different than mice that received PBS as determined by Mantel-Cox test. (B) Weight loss during IV ZIKV infection of 10–12-week-old mice following adoptive transfer. As a measure of disease, mice were weighed daily for 14 days. There were significant differences between the mice that receive ZIKV immune CD8+ T cells from group compared to the mice that received naïve CD8 T cells on day 7 (**p = 0.001) and day 8 (****p < 0.0001) determined using an unpaired t-test with Welch's correction. (C) The clinical scores associated with IV ZIKV challenge following adoptive transfer. Mice were evaluated for signs of neurological disease daily and graphed on each day as a percentage of mice displaying that disease indicator. Signs of disease range and in the most severe cases accelerate in the following manner from no apparent disease, limp tail, hind limb weakness, hind limb paralysis, complete paralysis, and death. (D) Viral burden in the peripheral and CNS tissues after CD8+ adoptive transfer and ZIKV infection. Ifnar1-/- mice that received CD8+ T cells from naïve or day 30 ZIKV immune C57BL/6J Ly5.1 mice were infected with 105 FFU ZIKV via IV route. On day 14 (n = 5 per group) post-infection, organs were harvested, snap frozen, weighed, and homogenized. Levels of viral RNA were quantified by qPCR in whole blood, liver, spleen, kidney, spinal cord, and brain. Data are shown as Log10 focus-forming unit equivalents (eq.) (as determined by standard curve) per gram or ml of tissue or blood, respectively. Asterisks indicate values that are statistically significant (*p < 0.05, **p < 0.001) as determined by Mann-Whitney test.

