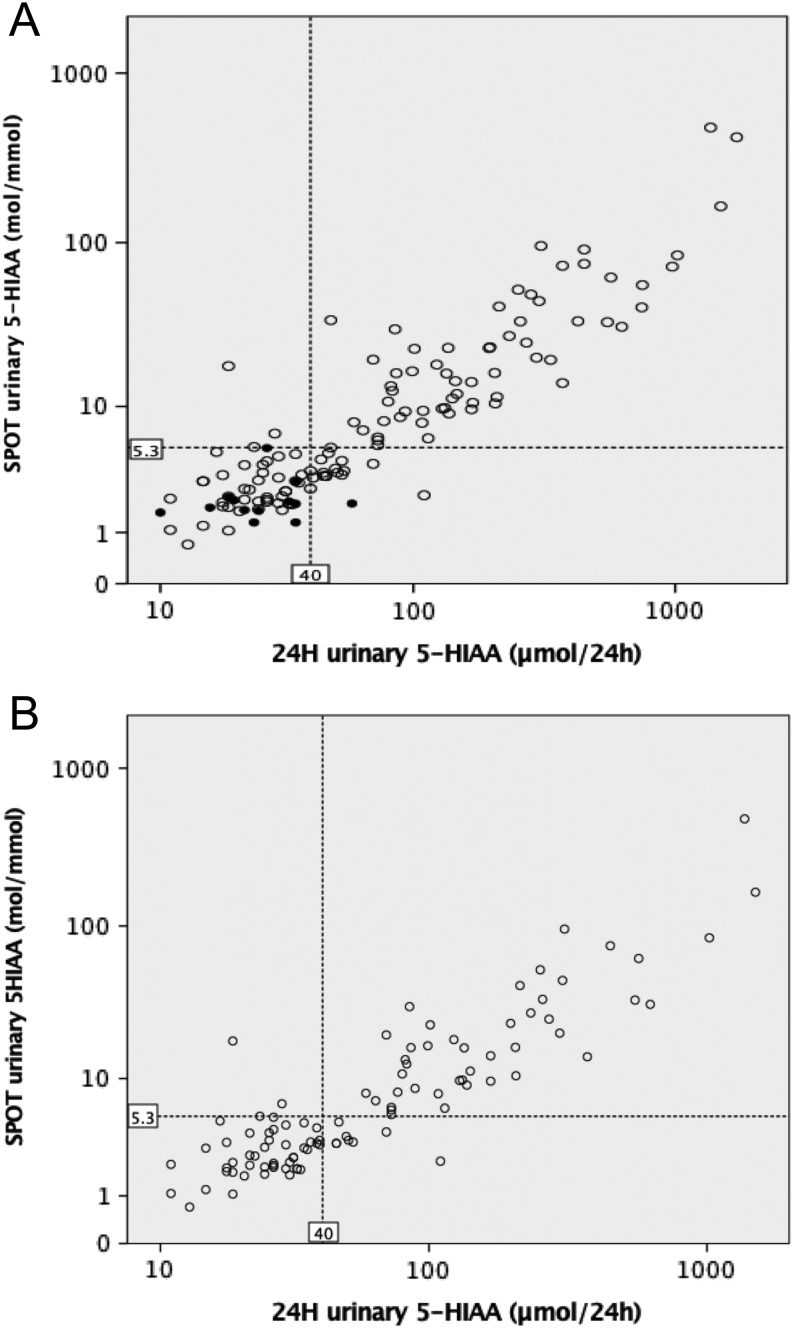
Figure 1.
Correlation between the 5-HIAA values measured in the 24-h urine and the spot urine for the total number of measurements in patients with and without a NEN diagnosis (A) and including one sample per patient from the group of patients with NEN (B). 5-HIAA values are plotted using logarithmic (log10) scale. The upper normal range for 24-h urinary 5-HIAA of 40 µmol/24 h and the suggested cut-off for the spot urinary 5-HIAA of 5.3 mol/mmol are shown by dashed lines. The white and black circles represent the measurements of patients, respectively, with and without a NEN diagnosis.

 This work is licensed under a