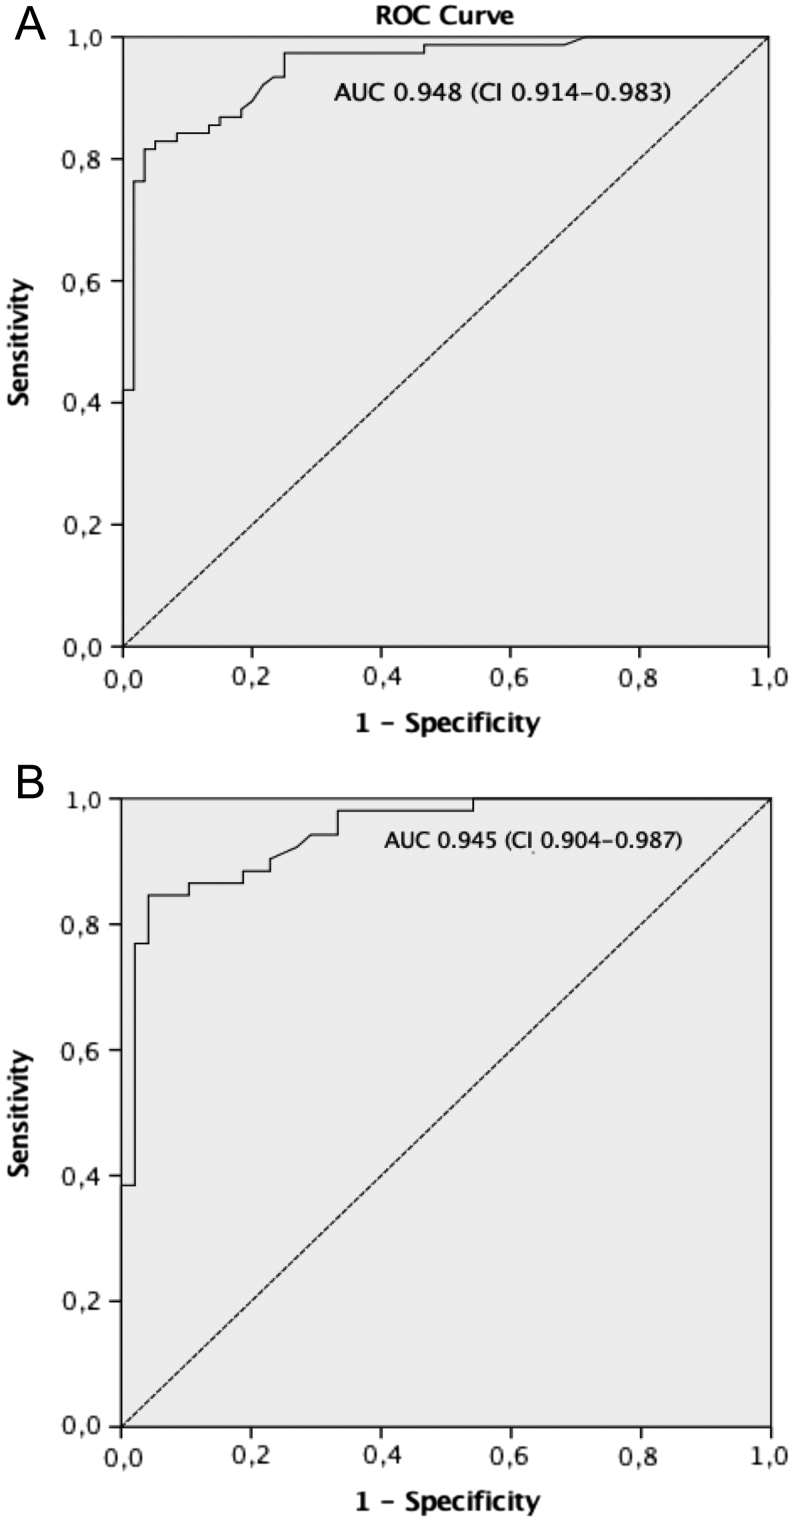
Figure 2.
ROC curve for spot urine 5-HIAA. The 24 h urine collection for 5-HIAA assessment (ULN 40 µmol/24) was used as the reference method. (A) ROC curve analysis for the total number of urinary 5-HIAA measurements (136 measurements). (B) ROC curve analysis including one sample per patient among patients with a diagnosis of NEN (100 measurements). The area under the ROC curve (AUC) and 95% confidence interval (CI) are reported.

 This work is licensed under a