Figure 2.
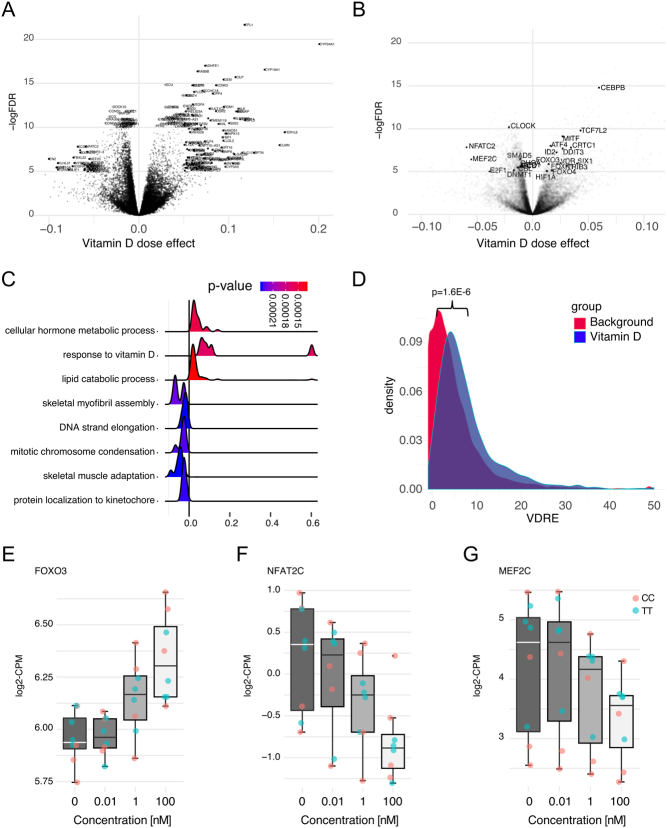
(A) Volcano plot illustrating genes differentially expressed in a dose-dependent manner upon stimulation with vitamin D. (B) Volcano plot highlighting transcription factors differentially expressed upon vitamin D stimulation. (C) Illustration of dose-dependent changes in gene expression of the top-most significant biological functions identified using gene-set enrichment analysis (GSEA). (D) Distribution of the number of VDR-responsive elements ≤10 kbp upstream of vitamin D dose-responsive genes (green), versus non-differentially expressed genes (red). (E) Boxplots of selected differentially expressed transcription factors illustrating vitamin D dose–response for three selected genes: FOXO3, NFAT2 and MEF2.

 This work is licensed under a