Figure 3.
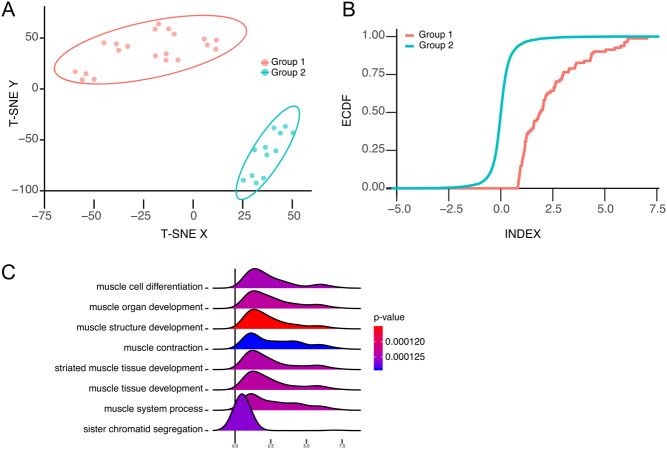
(A) Unsupervised cluster analysis of the transcriptome using tSNE revealed two distinct groups of cells. (B) Empirical cumulative distribution (ECDF) graph of genes involved in ‘muscle differentiation’ in the two groups. (C) Differences in gene expression between the two groups illustrated by ridgeplot of using gene-set enrichment analysis (GSEA).

 This work is licensed under a