Figure 4.

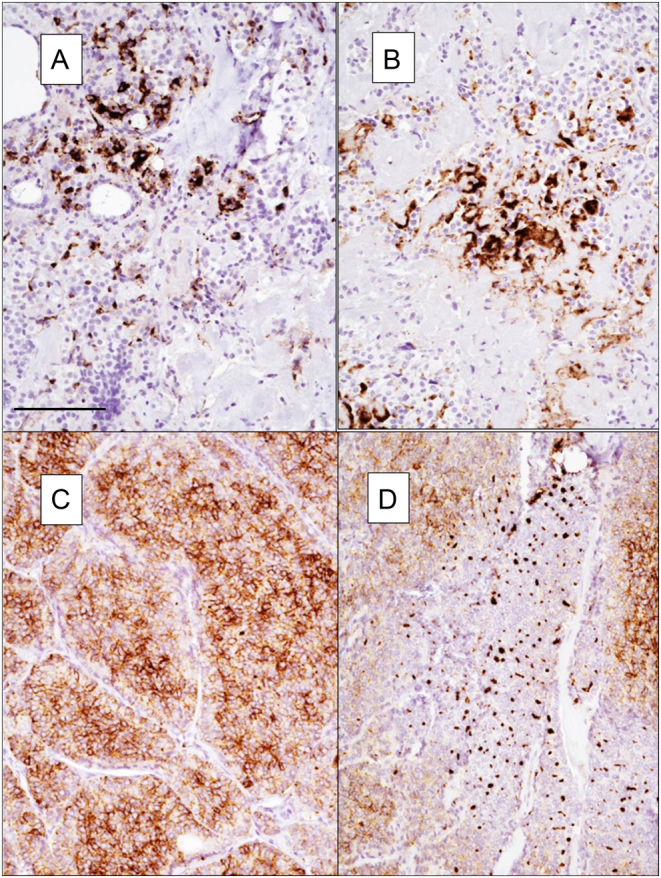
Pattern of NOTCH1 expression in MTC (A and B) and PDTC (C and D). In PDTC cytoplasmic granularity is thick and dot-like. Magnification 100×. Scale bar 100 µm.

Pattern of NOTCH1 expression in MTC (A and B) and PDTC (C and D). In PDTC cytoplasmic granularity is thick and dot-like. Magnification 100×. Scale bar 100 µm.