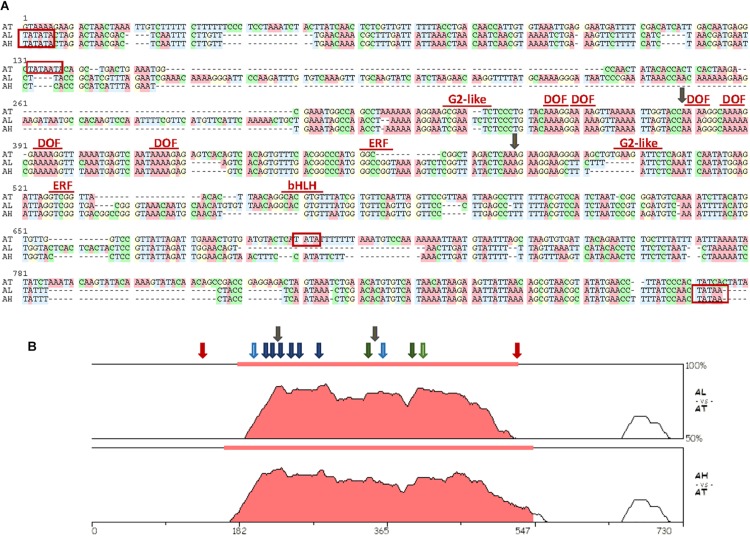
FIGURE 1.
Sequence characteristics of the region spanning the interval between putative TATA sequences in the bifunctional promoter. (A) Alignment of the nucleotide sequences of the selected interval. Names of transcription factor families mark their putative binding sites. TATA predicted sites are boxed in red. Insertion points for the T-DNA lines used are marked by gray arrows. Transcription factors sites were obtained using the binding site prediction tool in the PlantRegMap and the PlantTFDB 4.0 database. Alignment was prepared using the MUSCLE program in the SeaView4 platform. (B) The VISTA plots of pair-wise comparisons of putative bifunctional promoter sequences of A. lyrata and A. halleri species to A. thaliana as generated by the zPicture tool. Filled portions of the graphs indicate conservation of more than 50% with a width of at least 100 bp. Approximate locations of conserved binding sites for transcription factors are marked by arrows (dark blue, DOF; light blue, G2-like; dark green, ERF; light green, bHLH). TATA predicted sites for A. thaliana are marked by red arrows. Insertion points for the T-DNA lines used are marked by gray arrows.

