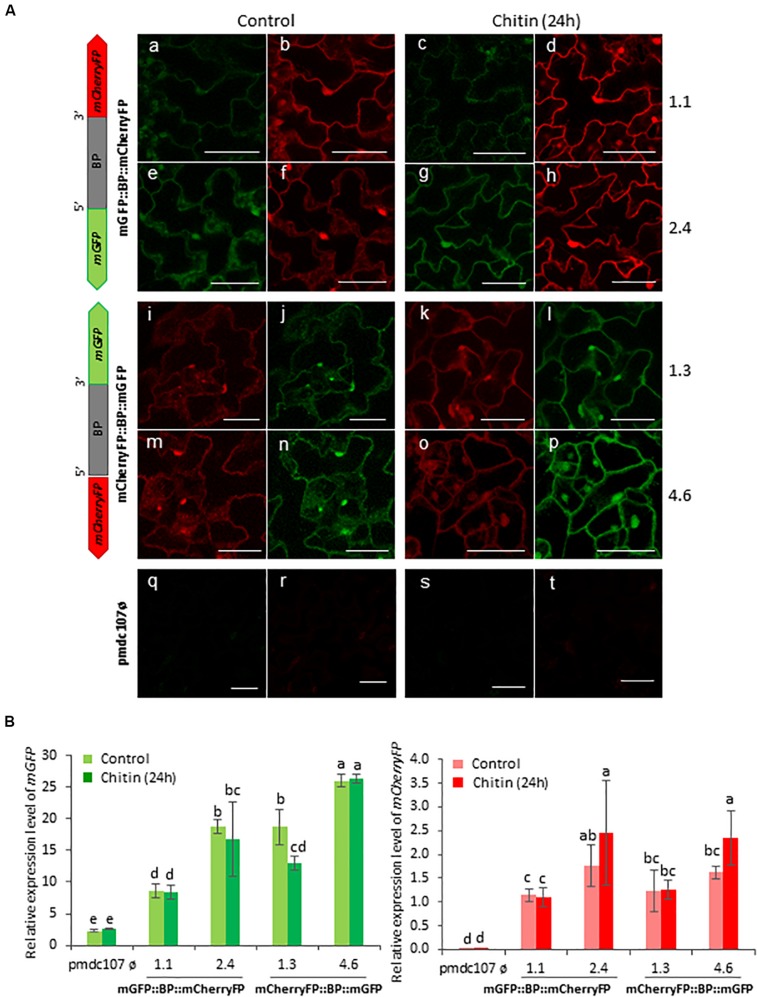
FIGURE 8.
Schematic representation of fusion-constructs and expression assays in stably transformed Arabidopsis plants in response to Chitin treatment. (A) Scheme of mCherryFP and mGFP genes driven by the bidirectional promoter (BD) and confocal stacks spanning Arabidopsis epidermal cells of transformed plants after 1 h of Chitin treatment. Projections are from mCherryFP (b,d,f,h,i,k,m,o,r,t) and mGFP (a,c,e,g,j,l,n,p,q,s). Bars are 50 μm. (B) Quantitative analyses of mGFP and mCherryFP expression by RT-qPCR in Arabidopsis transformed plants after 1 h of chitin treatment. Bars in green and red colors correspond to mGFP and mCherryFP gene expression, respectively. Data are ±SE of three biological replicates. Differential letters indicate statistical differences (P < 0.05 Wald χ2 followed by LSD test). Arabidopsis selected lines for mGP::BBP::mCherryFP construct were 1.1. and 2.4, and for mCherryFP::BD::mGFP were 1.3 and 4.6. Primers used for this experiment are listed in Supplementary Table 1.

