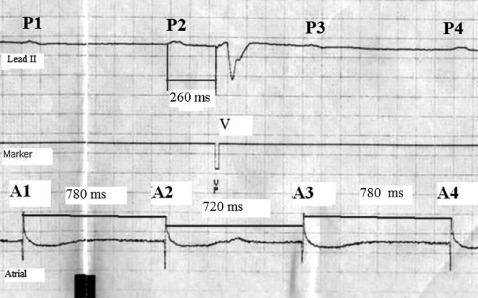
Figure 2.

Measurement of the P‐P interval shortening when a QRS is interposed. The upper channel is electrocardiogram lead II. It demonstrates 4 P waves (P1‐P4). Between the second and the third P waves, there is an interposed paced QRS complex (V). The middle channel, the marker channel, denotes the stimulus artifact of the paced QRS complex (VP). The bottom channel is the atrial electrogram, which demonstrates the 4 atrial events (A1‐A4) that correspond to the 4 surface P waves. The P‐P interval shortening was calculated by comparing A2‐A3 to A1‐A2: P‐P interval shortening = 100 × [(A1‐A2) − (A2‐A3)]/A1‐A2. In this example, P‐P shortening = 100 × [(60)/780] = 7.7%.
