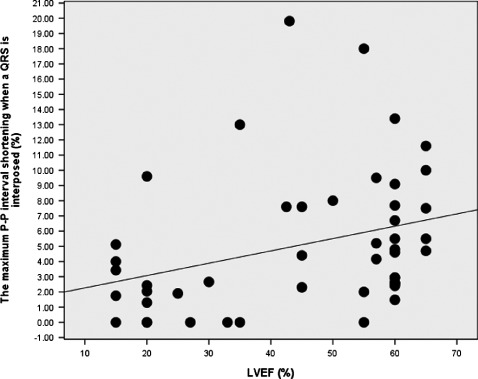
Figure 4.

Relationship between P‐P shortening and left ventricular ejection fraction (LVEF). The maximum value of P‐P shortening on each tracing decreases as the LVEF declines (r = 0.41, P = 0.004). Values ≤3% are seen at all values of LVEF, whereas P‐P shortening >3% is mainly observed when LVEF is ≥40%.
