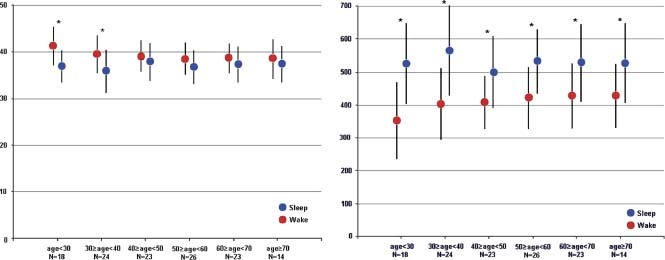
Figure 3.

Percent LV systolic time, % of R‐R interval, and LV diastolic perfusion time (ms). Left panel: %LVST (LVST / R‐R interval) in each age decade for awake and sleep. * P value <0.05 for awake vs sleep within 1 decade. Right panel: LDPT (time from S2 to the next onset of Q wave) for awake and sleep. * P value <0.05 for awake vs sleep within 1 decade. Abbreviations: LDPT, left ventricular diastolic perfusion time; LV, left ventricular; LVST, left ventricular systolic time; %LVST, percent left ventricular systolic time; S2, second heart sound.
