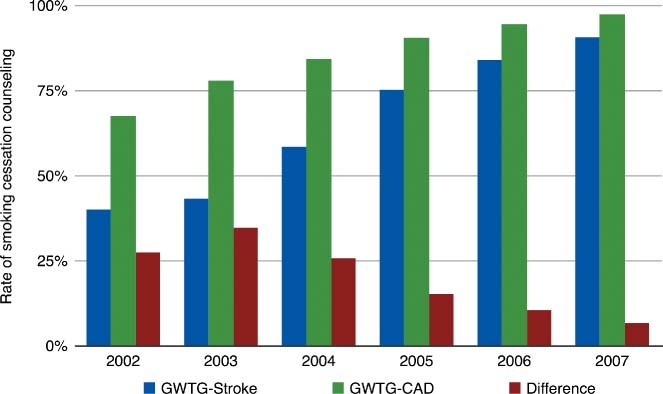
Figure 1.

Rates of smoking cessation counseling among eligible patients in GWTG‐CAD and GWTG‐Stroke. p < 0.001 for the yearly increase in both GWTG‐CAD and GWTG‐Stroke. The red bars represent the difference between the GWTG‐CAD and GWTG‐Stroke rates of smoking cessation counseling (p < 0.0001 for each year).
