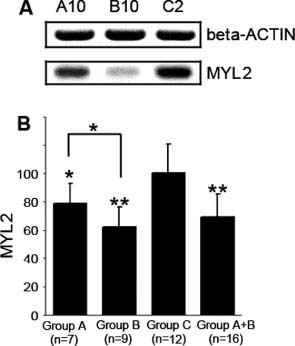
Figure 2.

Western blot and quantification of MYL2 protein. MYL2 was down‐expressed in HF tissue. (A) Western blot result of 3 representative samples. A specific ∼20 kDa band was observed for MYL2 protein. For HF patients A10 and B10, MYL2 expression is decreased compared with the C2 normal control. (B) Quantification showed that in moderate HF (group A), severe HF (group B), and total HF patients (group A + B), the relative MYL2 levels were 80%, 60%, and 70%, respectively, of control group C. The asterisk represents the statistical significance level of P < 0.05 and the double asterisk represents the statistical significance level of P < 0.01. The y‐axis is the relative expression level (%). The average expression level of the control group was set as 100%. Abbreviations: HF, heart failure; MYL2, myosin regulatory light chain 2
