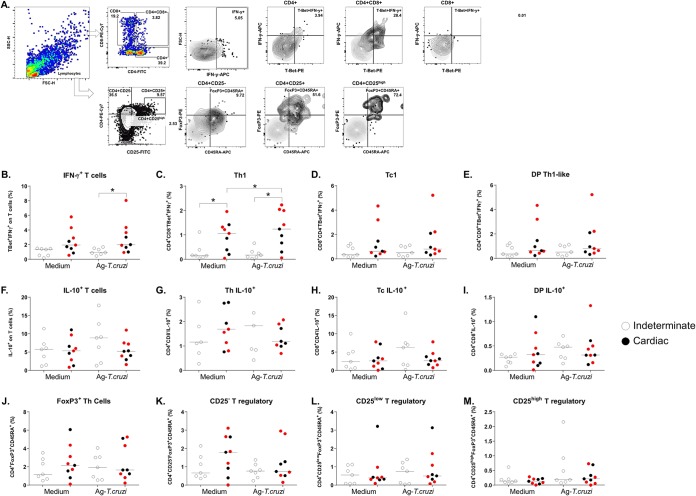
FIG 2.
The percentage of T lymphocytes after PBMC culture with T. cruzi antigens. (A) Gating strategy to determine the levels of IFN-γ and IL-10 expression in CD4+, CD8+, and CD4+ CD8+ DP T cells and in Treg subpopulations. FSC, forward scatter; SSC, side scatter. (B) IFN-γ+ T cells. (C) Th1, T-Bet+ IFN-γ+ in the CD4+ population. (D) Tc1, T-Bet+ IFN-γ+ in the CD8+ population. (E) DP-Th1-like, T-Bet+ IFN-γ+ among DP cells. (F to I) IL-10 expression in the same subpopulations. (J) FoxP3+ T cells. (K) CD4+ CD25− FoxP3+ T cells. (L) CD4+ CD25Low FoxP3+ T cells. (M) CD4+ CD25High FoxP3+ T cells. PBMCs were cultured without a stimulus (Medium) or with T. cruzi antigens (4 μg/ml; Ag-T.cruzi) for 72 h at 37°C in a humidified atmosphere with 5% CO2. Brefeldin A was added for incubation during the last 6 h, and the cells were stained with specific fluorochrome-conjugated antibodies against surface and intracellular molecules. Among the patients with cardiac Chagas disease (n = 9), red dots represent patients who progressed from the indeterminate form to the cardiac form or worsened at 48 months after benznidazole treatment (n = 5). Horizontal lines represent the median. *, P < 0.05 (Mann-Whitney or Wilcoxon’s test).

