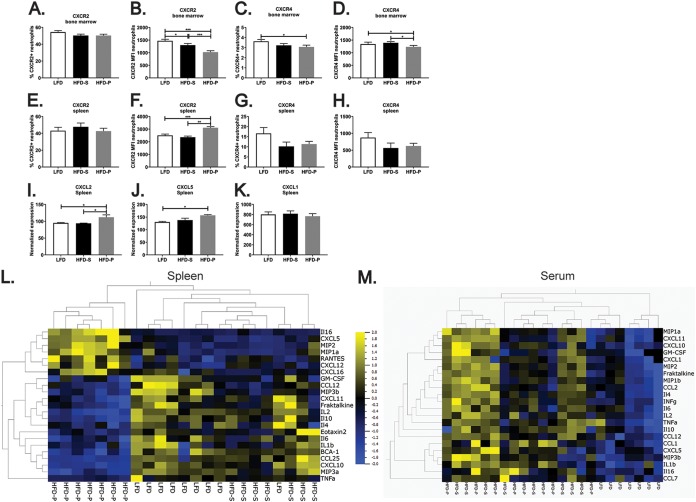
FIG 4.
HFD-P induces the secretion of chemoattractant molecules to recruit neutrophils into the spleen. (A to D) Quantification of the percentage of CXCR2+ neutrophils (A), the CXCR2 mean fluorescence intensity (MFI) of neutrophils (B), the percentage of CXCR4+ neutrophils (C) and the CXCR4 MFI of neutrophils (D) in the bone marrow of mice fed LFD, HFD-S, and HFD-P for 8 weeks. Data are for 10 mice per group. (E to H) Quantification of the percentage of CXCR2+ neutrophils (E), the CXCR2 MFI of neutrophils (F), the percentage of CXCR4+ neutrophils (G), and the CXCR4 MFI of neutrophils (H) in the spleens of mice fed LFD, HFD-S, and HFD-P for 4 weeks. Data are for 10 mice per group. (I to K) Gene expression of CXCL2 (I), CXCL5 (J), and CXCL1 (K) in the spleens of mice fed LFD, HFD-S, and HFD-P for 8 weeks normalized to actin expression. Data are for 4 mice. (L and M) Heat map representation of the chemokine and cytokine secretion profile in the spleen (L) and serum (M) of mice fed LFD, HFD-S, and HFD-P for 4 weeks (P ≤ 0.05). Data are for 7 to 9 mice per group. Data are shown as the mean + SEM. *, P ≤ 0.05; **, P ≤ 0.01; ***, P ≤ 0.001.

