FIG 3.
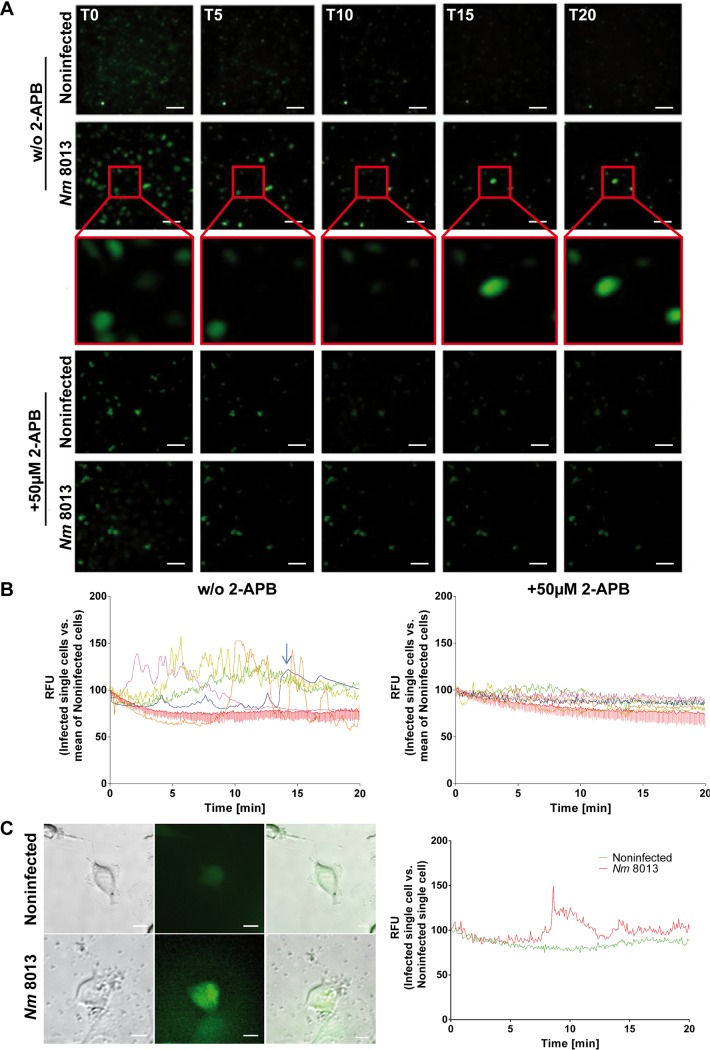
N. meningitidis increases cytosolic Ca2+ levels in brain endothelial cells derived from the endoplasmic reticulum. Fluo-8-loaded HBMEC were infected with N. meningitidis 8013 in the presence or absence of 50 μM 2-APB or were left noninfected, and cytosolic Ca2+ concentrations were monitored over 20 min. Images were captured using a Nikon Eclipse Ti-E inverted microscope and analyzed using NIS Elements AR software (Nikon). (A) Representative fluorescence images taken at the indicated time points (0, 5, 10, 15, and 20 min [T0, T5, T10, T15, and T20, respectively]) are shown. Images were taken at a ×20 magnification. Bars, 100 μm. (B) Fluorescence data from representative cells were exported and are shown as the number of relative fluorescence units (RFU) relative to the start fluorescence intensity value. Images show the results for infected single cells (left) or 2-APB-treated cells (right) versus the mean for noninfected cells. The arrow indicates the results for a single cell which appears at 15 min in the inset in panel A. 2-APB, 2-aminoethoxydiphenyl borate. (C) Representative single-cell analysis results. Pictures (left) show single cells which were analyzed for their fluorescence intensity (right). Bars, 10 μm.

