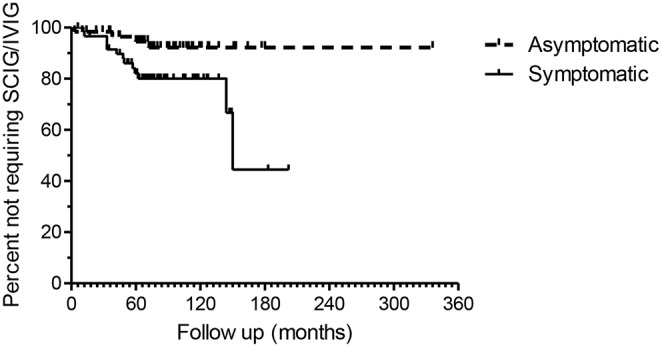
Figure 4.

Kaplan–Meier plots of the asymptomatic and symptomatic patients. The endpoint is time to SCIG/IVIG treatment. The duration of observation is based on the first available IgG level in NHI-linked electronic records. The difference in the two survival curves is highly significant (p = 0.0147), Log rank Mantel Cox test.
