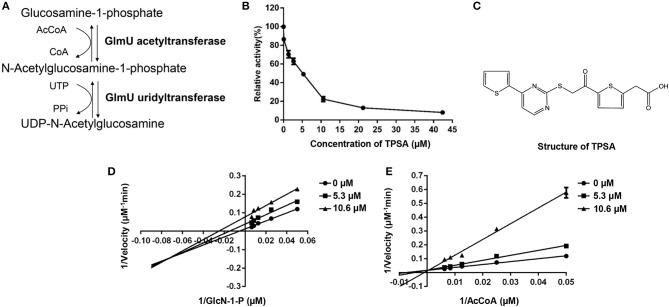
Figure 1.
The enzymatic reactions catalyzed by GlmU (A) and the inhibition effect of TPSA on GlmU acetyltransferase activity (B), molecular structure of TPSA (C), and the inhibition types of TPSA on GlmU acetyltransferase (D,E). Double reciprocal plots showed 1/v vs. 1/s, where v was the initial velocity and s was the substrate concentration for GlcN-1-P and AcCoA. In (B,D,E), the values plotted are the mean value and standard deviation from triplicate experiments.

