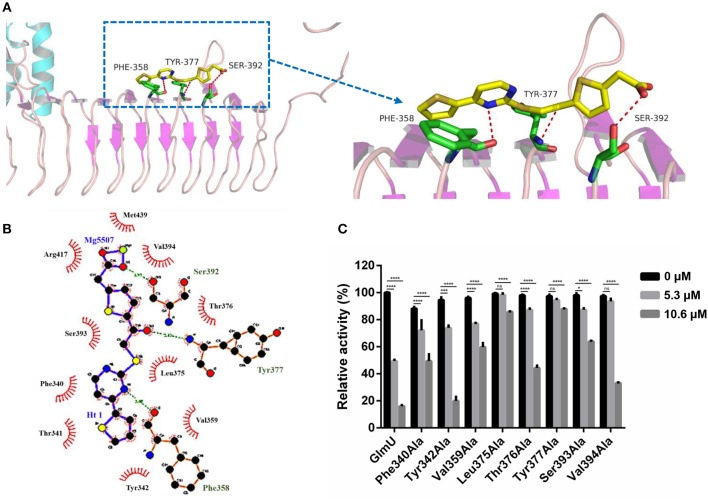
Figure 2.
Post-docking interactions between active site residues of GlmU acetyltransferase with TPSA (A,B) and the relative activity of different GlmU protein mutants (C). In (C), the experiment was carried out in triplicate and the graph indicates the mean value with standard deviation bars. Differences among groups were calculated by unpaired two-tailed t-test. The asterisks represent the statistical differences between the relative activity of GlmU and GlmU mutants in different concentrations of TPSA-treated group. ns, no significance; *P < 0.05; ***P < 0.001; ****P < 0.0001 (The P-values of untreated group to 5.3 μM TPSA treated group for GlmU, P < 0.0001; Phe340Ala, P < 0.0001; Tyr342Ala, P < 0.0001; Val359Ala, P < 0.0001; Leu375Ala, P = 0.5572; Thr376Ala, P < 0.0001; Tyr377Ala, P = 0.0815; Ser393Ala, P = 0.0012 and Val394Ala, P = 0.3158. The P-values of untreated group to 10.6 μM TPSA treated group for GlmU, P < 0.0001; Phe340Ala, P < 0.0001; Tyr342Ala, P < 0.0001; Val359Ala, P < 0.0001; Leu375Ala, P < 0.0001; Thr376Ala, P < 0.0001; Tyr377Ala, P < 0.0001; Ser393Ala, P < 0.0001 and Val394Ala, P < 0.0001).

