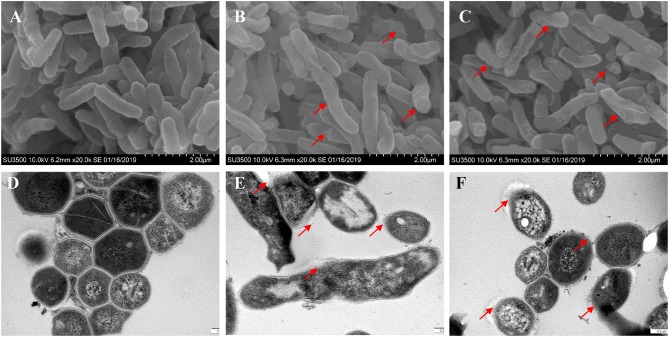
Figure 4.
Scanning electron microscopy and transmission electron micrographs of Mtb H37Ra cells. SEM of untreated cells of Mtb H37Ra (A) and Mtb H37Ra treated with TPSA (2×MIC) for 24 h (B,C) (20,000×). Red arrows in (B,C) depict the unsmooth and wrinkled surface of bacilli. TEM of untreated cells of Mtb H37Ra (D) and Mtb H37Ra treated with TPSA (2×MIC) for 24 h (E,F) (80,000×). Red arrows in (E,F) point to the areas of bacilli lysis or cell wall rupture.

