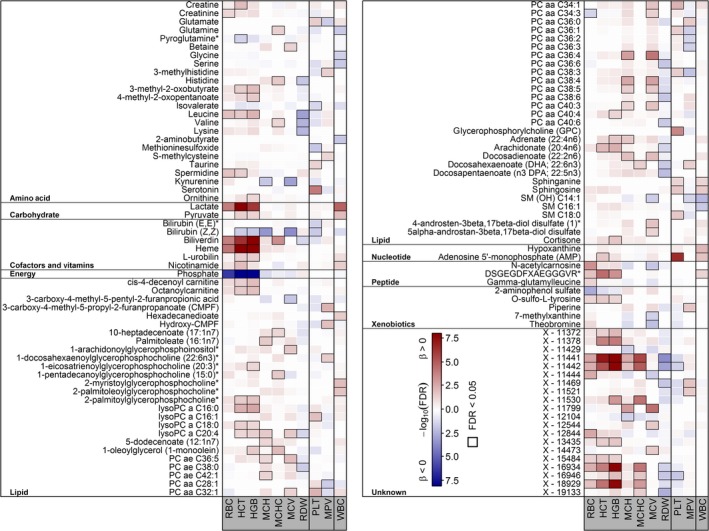
Figure 1.

Heat map of corrected P‐values (controlling the false discovery rate [FDR] at 5%) from linear regression analyses using one of the red blood cell count traits as exposure and metabolites as outcome adjusting for age, sex, waist circumference, smoking, serum alanine aminotransferase activities and estimated glomerular filtration rate. Orange shading indicates positive and blue shading indicates negative associations, respectively. HCT, haematocrit; HGB, hemoglobin; MCH, mean corpuscular hemoglobin; MCHC, mean corpuscular haemoglobin concentration; MCV, mean corpuscular volume; MPV, mean platelet volume; PLT, platelets; RBC, red blood cells; RDW, red cell distribution width; WBC, white blood cells
