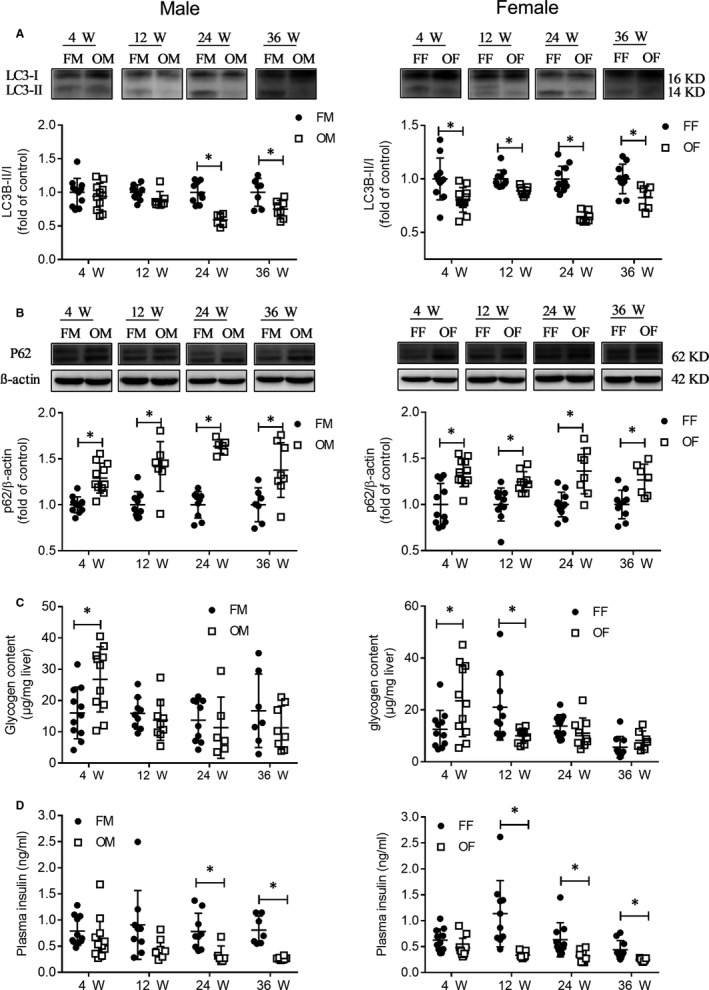
Figure 4.

Changes of liver autophagy protein, hepatic glycogen content and plasma insulin level. A, LC3B protein expression was detected by Western blot. B, P62 protein expression was detected by Western blot. C, Liver tissue glycogen content. D, Plasma insulin levels. Data were compared by unpaired t test, * P < 0.05 vs FVB mice in same age and gender. Data were presented as means ± SD
