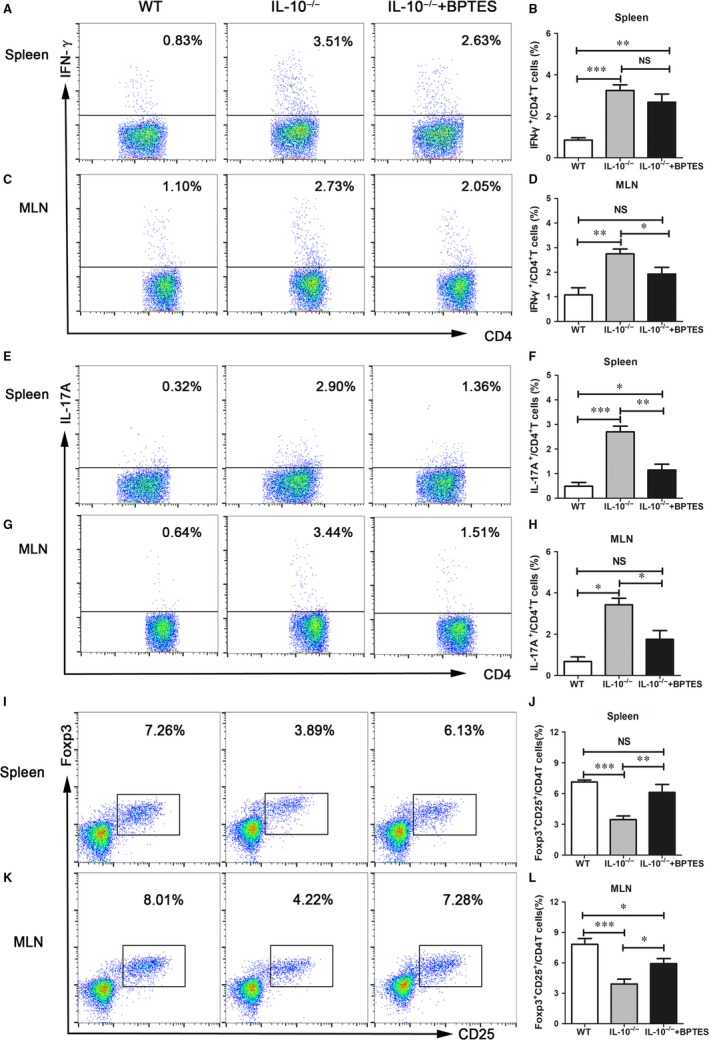
Figure 4.

BPTES treatment maintains the Th/Treg balance in IL‐10−/− mice. Splenocytes and mesenteric lymph node cells from each group were prepared at the fourth week after drug administration. IFN‐γ‐producing CD4+ T cells and IL‐17A‐producing CD4+ T cells were quantified by intracellular cytokine staining as described in the Section 22. (A,C) Representative flow cytometric images of IFN‐γ‐producing CD4+ T cells. Summary of the percentage (B,D) of IFN‐γ‐producing CD4+ T cells. (E,G) Representative flow cytometric images of IL‐17A‐producing CD4+ T cells. Summary of the percentage (F,H) of IL‐17A‐producing CD4+ T cells. (I,J) Representative flow cytometric images of CD4+ CD25+ Foxp3+ T cells in different organs. Summary of the percentage (K,L) of CD4+ CD25+ Foxp3+ T cells. The data are expressed as the mean ± SD (n = 8 per group). BPTES, bis‐2‐ (5‐phenylacetamido‐1,2, 4‐thiadiazol‐2‐yl) ethyl sulphide; IFN, interferon; IL, interleukin; NS, no significance; *P < 0.05, **P < 0.01, ***P < 0.001
