
Figure 2.
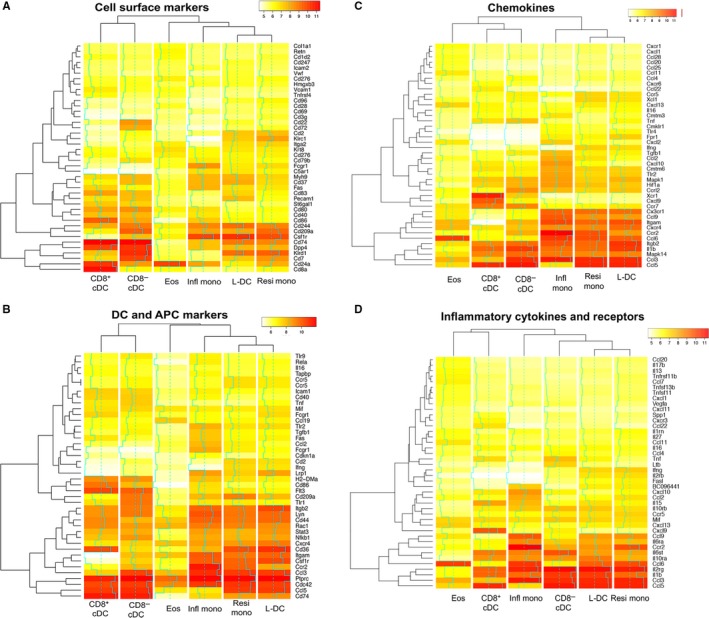
Pathway‐specific gene expression in dendritic and myeloid subsets. Data mining was applied to Affymetrix data sets collected from “L‐DC,” cDC and myeloid subsets prepared in duplicate experiments. For each subset, log2 average signal values were plotted as a heat map. The line chart (blue) overlaid on heat maps indicates log2 signal intensity changes about the mean (dashed blue line). Genes were clustered by level of expression as shown by row dendrograms. In addition, dendritic and myeloid subsets were clustered on the basis of gene expression as shown by column dendrograms. Data mining involved sets of genes utilized by SABioscience for their PCR arrays. These reflect: (A) Cell surface markers, (B) DC and APC markers, (C) Chemokines and (D) Inflammatory cytokines and receptors