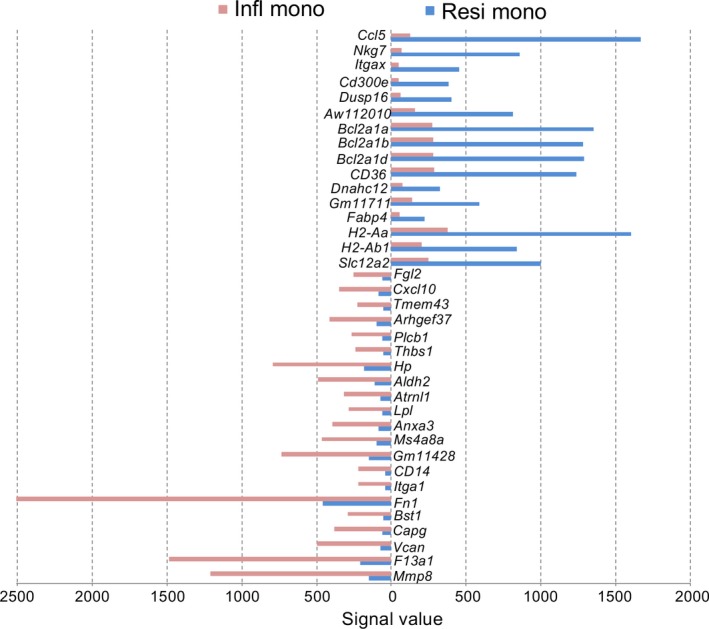
Figure 5.

Genes upregulated in either resident monocytes or inflammatory monocytes. ANOVA was used to make pairwise comparisons between average gene expression (n = 2) in inflammatory and resident monocytes. Genes were selected which showed ≥4‐fold change in mean signal value in either resident monocytes (Resi mono) or inflammatory monocytes (Infl mono), where mean signal value in both subsets was ≥50
