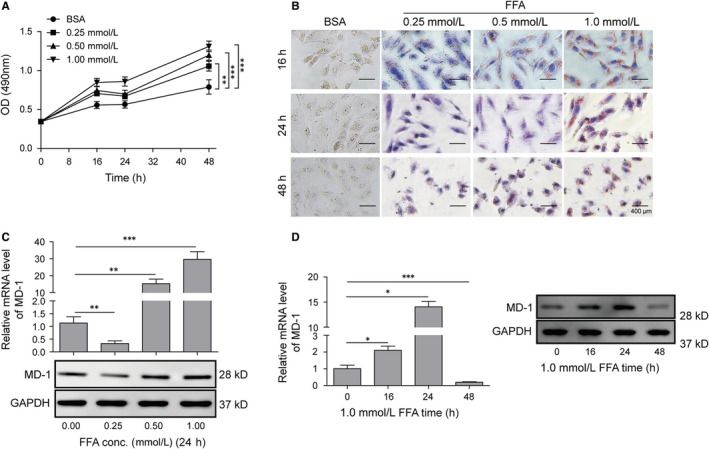
Figure 1.

Free fatty acid (FFA) induced lipid accumulation and MD‐1 differential expression in cardiomyocytes. (A) Proliferation curve of H9C2 measured with MTT assay. (B) Oil red O staining of H9C2. Cellular lipid accumulation was stained as bronzing droplets in the images. (C) qPCR and western blot analysis of MD‐1 level. The mRNA and protein levels of MD‐1 were determined following the treatment of FFA at the indicated doses. GAPDH was used as an internal control. (D) qPCR and western blot analysis of MD‐1 level. The mRNA and protein levels of MD‐1 were determined following the treatment of 1.0 mmol/L FFA for the indicated time. *P < 0.05, **P < 0.01, ***P < 0.001
