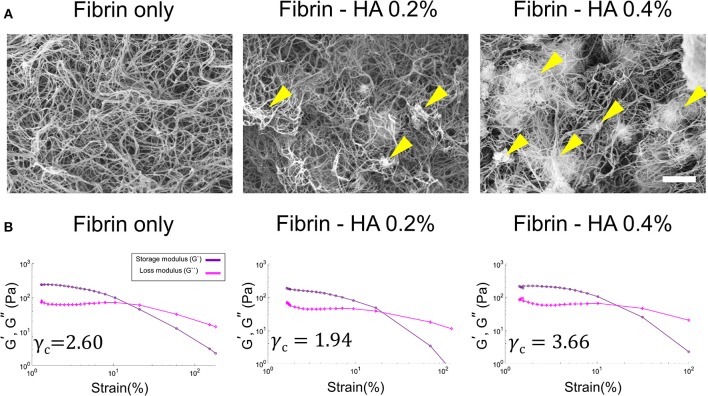
Figure 2.
(A) SEM images of HA/fibrin composite with varying concentration of HA component (0.0, 0.2, and 0.4%). (Scale bar: 2 μm). Yellow arrows indicate agglomerated locations. (B) The storage and loss modulus as a function of strain at the same temperature and oscillation frequency in gel rheology analysis, indicating critical strain for each plot.

