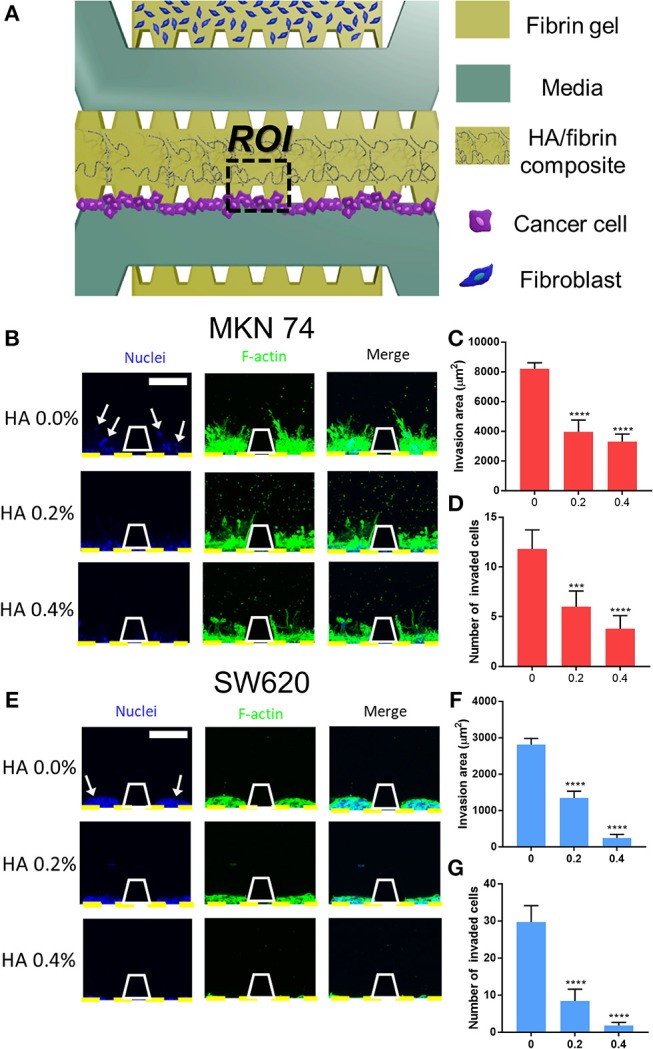
Figure 4.

Cancer cell migration in HA/fibrin composite in the microfluidic platform. (A) Schematic representation of assay to observe migration of cancer cells cultured in the HA/fibrin composite in TME co-cultured with fibroblasts. Confocal images and graphs for the number of invaded cancer cells and invasion area per ROI for (B–D) MKN74, and (E–G) SW620 respectively in HA/fibrin composite with varying HA concentration (0.0, 0.2, and 0.4%) (n = 5–9 chips per condition) (white arrows indicate nuclei of migrated tumor cell into tunable bone mimicking ECM). (Scale bar: 100 μm).
