
Figure 1.
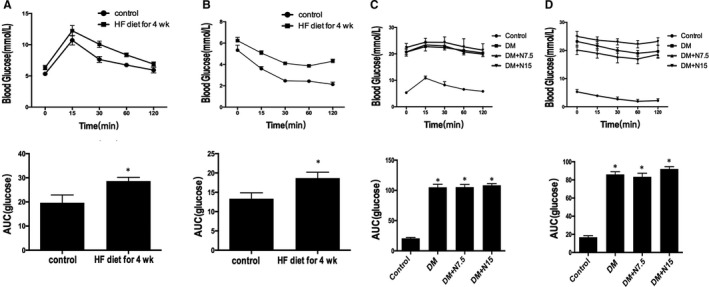
Characteristic of type 2 diabetic rats. IPGTT(A) and IPITT(B) were performed after 4 weeks of high‐fat diet. AUC were calculated in control and HF group. After nicorandil treatment for 4 weeks, IPGTT(C) and IPITT(D) were performed in four groups. AUC were calculated in 4 groups. *P < 0.05 compared with the control group