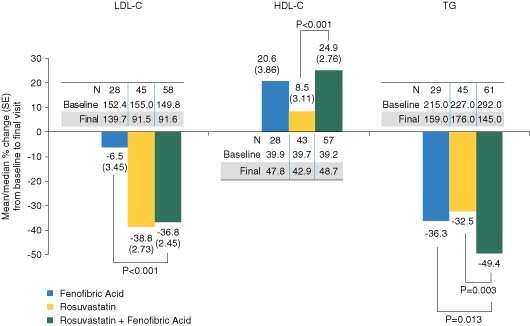
Figure 2.

Efficacy in elderly patients with T2DM. The mean percent changes (SE) in LDL‐C and HDL‐C, and the median percent changes in TG following 12‐week treatment are shown for the subgroup of patients with T2DM, in addition to the baseline and final mean or median values in mg/dL. Data were pooled among the doses of R (5, 10, and 20 mg) monotherapy and R (5, 10, and 20 mg) + FA combination therapy. Abbreviations: FA, fenofibric acid; HDL‐C, high‐density lipoprotein cholesterol; LDL‐C, low‐density lipoprotein cholesterol; R, rosuvastatin; SE, standard error; T2DM, type 2 diabetes mellitus; TG, triglycerides
