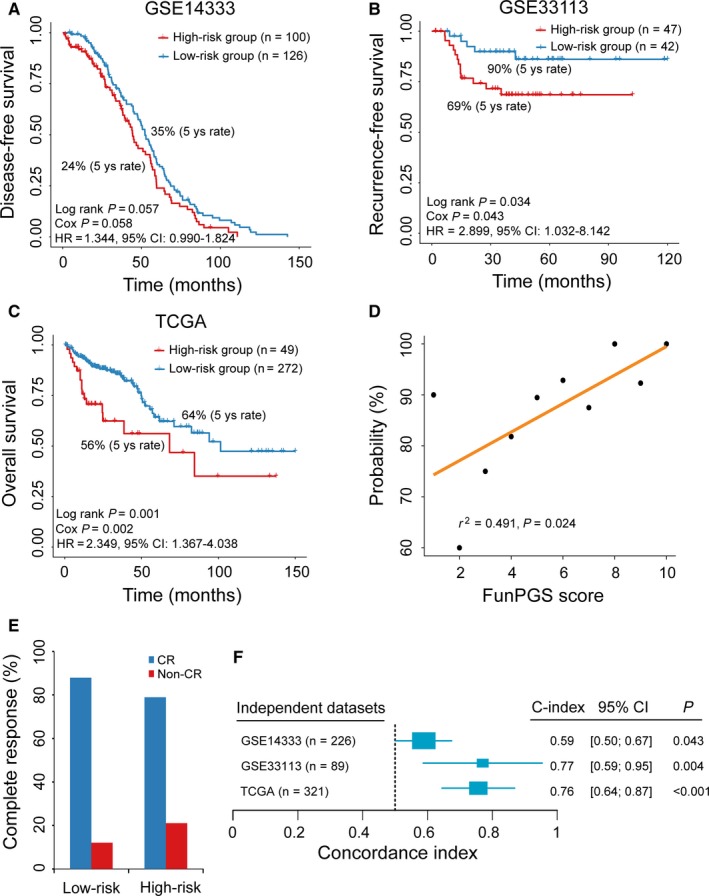
Figure 4.

Prognostic independent evaluation of the FunPGS. Kaplan‐Meier curves of patients with colorectal cancer at low or high risk stratified by the FunPGS in the (A) GSE14333, (B) GSE33113 and (C) TCGA datasets. (D) Correlation of the FunPGS with CR. The Pearson's correlation coefficient was calculated to assess the association between the FunPGS and the likelihood of CR The straight line depicts the least squares linear regression line fitted to the data points. (E) Differences in CR ratios between the high and low‐risk groups stratified by the FunPGS. (F) Forest plot visualizing the C‐index of the FunPGS in all independent validation datasets. The horizontal line corresponds to the 95% confidence interval and the pink vertical line indicates a C‐index of 0.5. CR, complete response; C‐index, Harrell's concordance index
