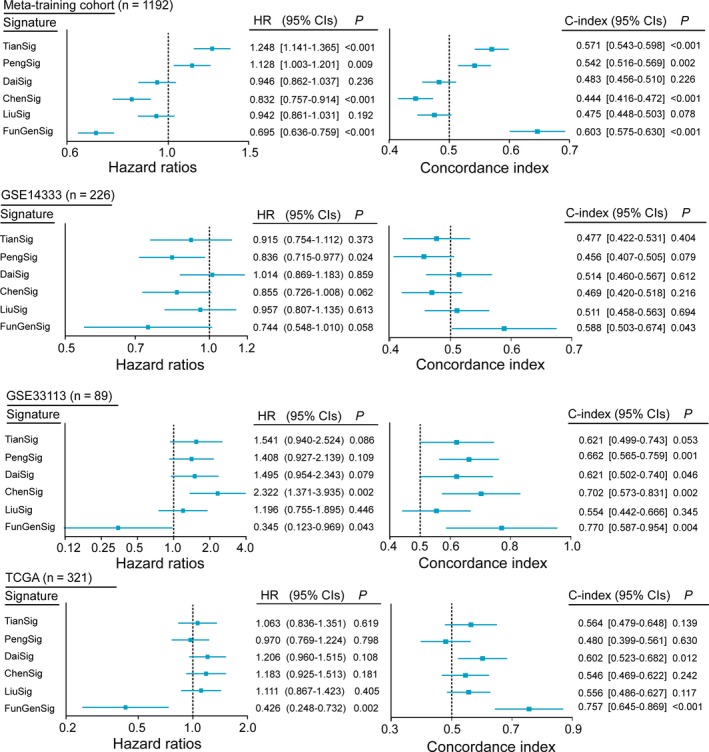
Figure 6.

Prognostic comparison of the FunPGS with recently published signatures. Performance of the FunPGS in comparison with five previously published gene signatures. Forest plot visualizing the HRs of univariate analysis and C‐index of the FunPGS in the meta‐training cohort and all the independent validation datasets. The horizontal line corresponds to the 95% confidence interval and the pink vertical line indicates a HR of 1.0 and a C‐index of 0.5. HR, hazard ratio; C‐index, Harrell's concordance index
