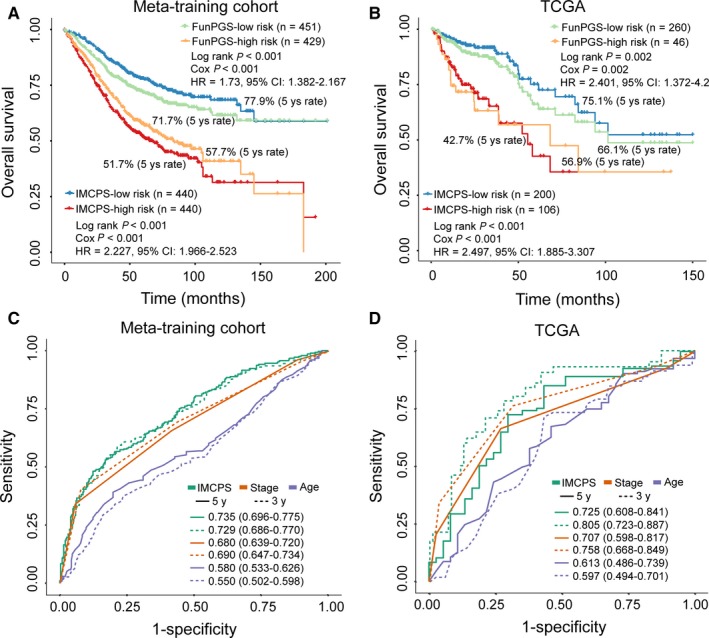
Figure 7.

Assessment of the prognostic performance of the IMCPS. Kaplan‐Meier curves of overall survival for patients with colorectal cancer at low or high risk stratified by the FunPGS or the IMCPS in the (A) meta‐training cohort and (B) TCGA dataset. Time‐dependent ROC curves at 3 or 5 years for the FunPGS or IMCPS in the (C) meta‐training cohort and (D) TCGA dataset
