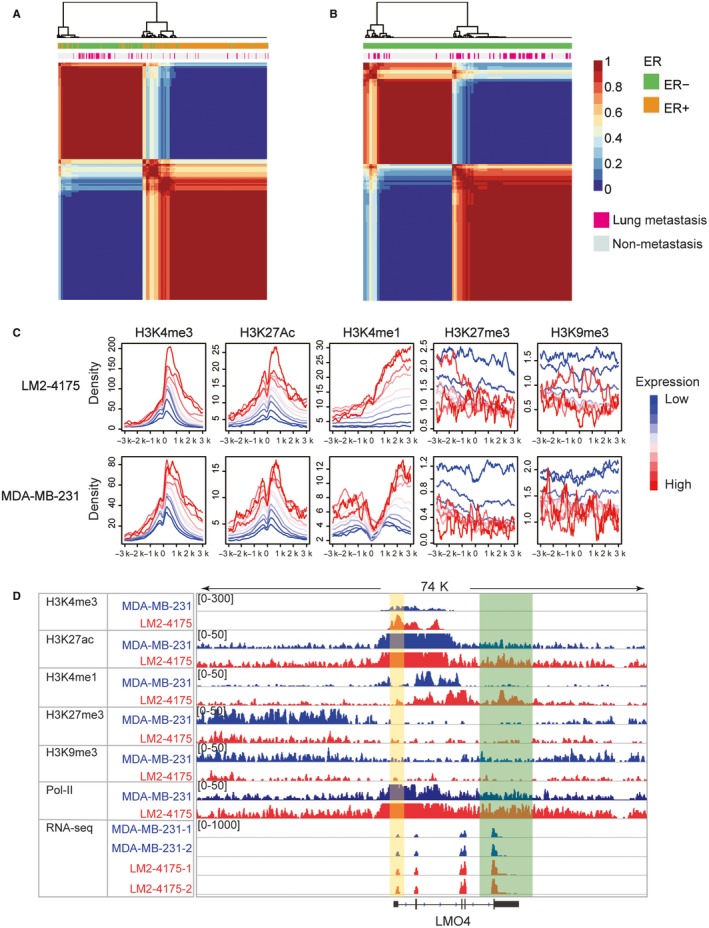
Figure 1.

Integrated analysis of transcriptome and genome‐wide histone modification data. (A) Nonnegative matrix factorization (NMF) clustering for 404 breast cancer patients using expression values of differentially expressed genes between MDA‐MB‐231 and LM2‐4175. Both ER and metastasis state were shown by the annotation colour bar. (B) NMF clustering for 164 ER‐ breast cancer patients using expression value of differentially expressed genes between MDA‐MB‐231 and LM2‐4175. Both ER and metastasis state were shown by the annotation colour bar. (C) The average tag density profiles of multiple histone modifications around the TSSs clustered according to the expression values of their associated genes. Blue lines represented low expressed genes, and red lines represented high expressed genes.(D) Chromatin modification changes from MDA‐MB‐231 to LM2‐4175 around transcription factor LMO4. The region covered by yellow box represents promoter, and green box represents enhancer
